Medicine · 7 min read
Understanding relative versus absolute risk
A 50% risk reduction can mean very different things. Work through absolute risk, relative risk, baseline risk, and number needed to treat using clear hypothetical examples.
For general education only; not personal medical advice. Discuss individual care and research participation with a qualified healthcare professional.
Information may contain errors, omissions or outdated guidance. This article is general education, not individual medical or other professional advice. Verify important information before acting and consult an appropriately qualified professional. Never disregard medical advice, delay care or change treatment because of this article. See our accuracy disclaimer and terms.
First define the event and the clock
Absolute risk is the chance of an outcome in a specified population over a specified period. A statement such as ten people out of one hundred needs both an outcome and a time frame. Ten experiencing a symptom during one week means something different from ten being admitted to hospital over ten years. The National Cancer Institute emphasizes population and time when explaining absolute risk.
Before doing arithmetic, write the question in a sentence: among which people, how many experienced what, during which period? Without those details, a percentage may sound precise while leaving the decision itself unclear.
Sources: [5]
One hypothetical example, expressed three ways
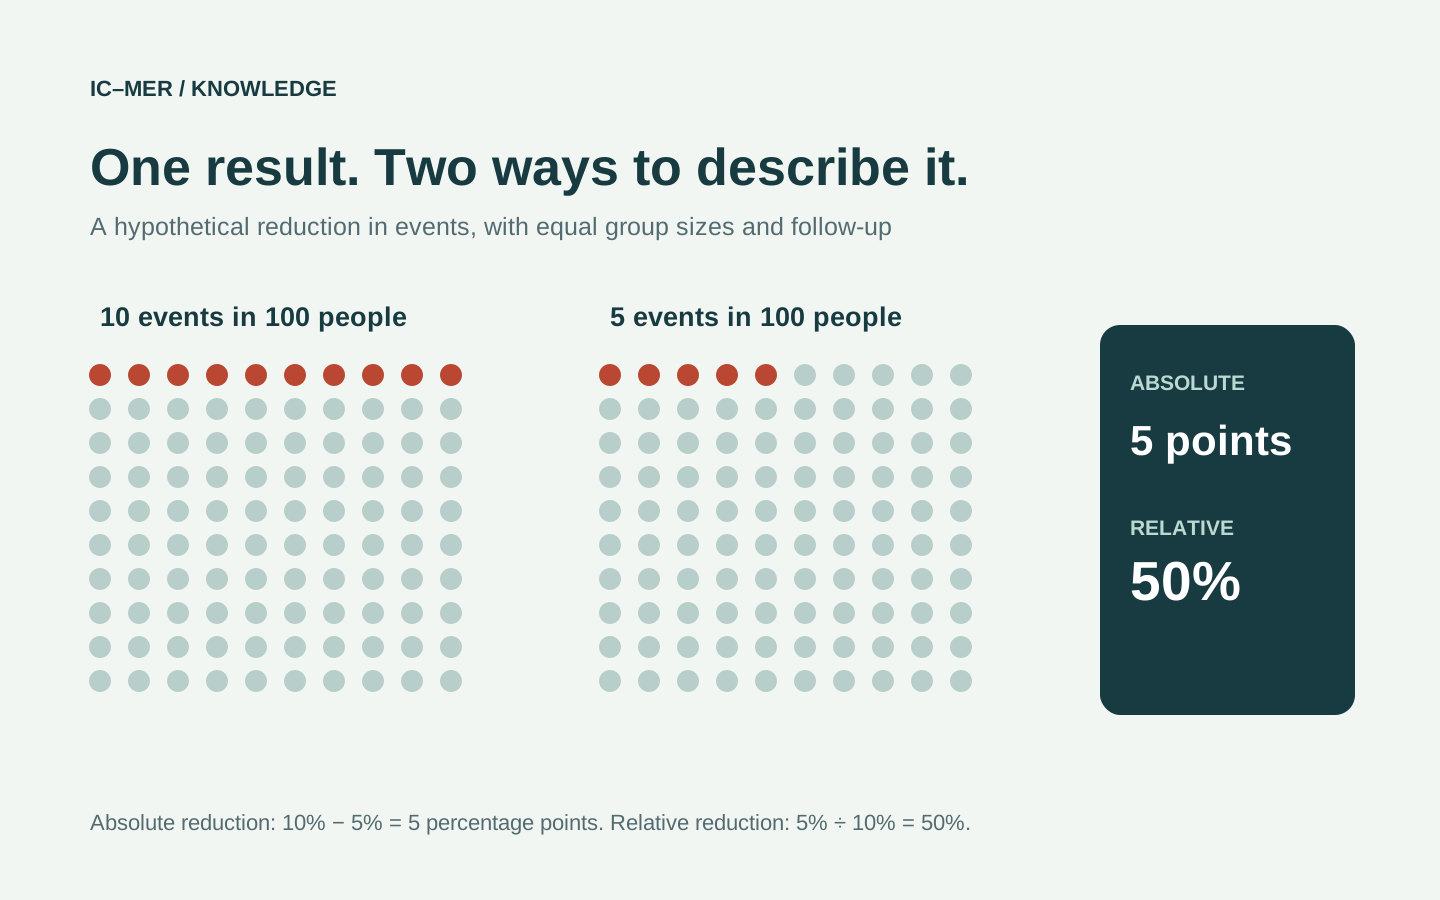
Imagine a fictional study that follows two groups of 100 people for one year. In the comparison group, 10 people experience the outcome. In the intervention group, 5 do. These numbers are invented for teaching and are not evidence for any medicine, test, or preventive measure.
The comparison risk is 10 divided by 100, or 10%. The intervention risk is 5 divided by 100, or 5%. Subtracting gives an absolute risk reduction of 5 percentage points: 10% minus 5%. In natural frequencies, that is 5 fewer people with the outcome for every 100 people over the year.
The risk ratio is 5% divided by 10%, which equals 0.5. The relative risk reduction is 1 minus 0.5, or 50%. Both descriptions fit the same hypothetical result. Neither the five-percentage-point reduction nor the 50% reduction is the probability that a particular person will benefit. They summarize a comparison between groups.
Sources: [1]
Percentage points prevent a common ambiguity
If someone says risk fell by five percent, ask what they mean. A fall from 10% to 5% is five percentage points. A five-percent relative reduction from a starting risk of 10% would instead produce 9.5%: multiply 10% by 0.95. The difference between 5% and 9.5% is substantial even though casual wording can blur it.
Try the reverse calculation. In a second fictional example, an outcome rises from 3 in 100 people to 6 in 100. The absolute increase is 3 percentage points, while the relative increase is 100%: the risk doubled. Doubled does not mean that everyone experiences the outcome. It describes the relationship between two starting and ending values.
The same relative change can have a different absolute size
Now keep the hypothetical relative reduction at 50% but change the starting risk. If 2 of 100 people would experience the outcome in the comparison group and 1 of 100 in the intervention group, the absolute reduction is 1 percentage point. If the risks are 20 of 100 and 10 of 100, the absolute reduction is 10 percentage points.
These are illustrative calculations that assume the same relative effect applies in both populations. Real evidence may not justify that assumption. They show why a headline reporting only a relative reduction leaves out information needed to understand the size of the difference. Ask for both group risks, using the same denominator and period.
Sources: [2]
Number needed to treat adds a useful translation
For a beneficial reduction in an unwanted outcome, the number needed to treat is the reciprocal of the absolute risk reduction expressed as a proportion. In the original fictional example, 1 divided by 0.05 equals 20. Over the stated year, treating 20 people rather than using the comparison option corresponds to one additional person avoiding that outcome on average.
It does not mean exactly one person in every set of twenty benefits, or that nineteen receive no other effect. The number depends on the particular outcome, comparator, population, and follow-up. An NNT without those details is incomplete. Harms need their own outcome-specific comparison; a benefit calculation cannot account for them automatically.
Sources: [2]
Odds ratios and hazard ratios need their own interpretation
A risk ratio compares probabilities. An odds ratio compares odds—the chance of an event relative to the chance of no event. They are not interchangeable, especially when outcomes are common. A report that states an odds ratio of 0.5 should not automatically be rewritten as half the risk.
A hazard ratio concerns a time-to-event analysis and also should not be substituted directly for a fixed-period risk ratio. Cochrane describes methods for converting time-to-event results into absolute estimates using additional assumptions and a specified observation period. If a news story provides only an odds ratio or hazard ratio, ask for an appropriate absolute-risk presentation rather than inventing one.
A calculated effect still carries uncertainty
A study reports an estimate, not an exact promise. A confidence interval communicates statistical uncertainty around that estimate. To keep the concept concrete, imagine one fictional study estimating five fewer events per hundred but with uncertainty spanning a very small reduction to a much larger one. Another study could have the same central estimate with a much narrower interval. The best estimate is identical; its precision is different.
Precision is also only part of the assessment. Cochrane’s evidence framework considers study limitations, inconsistency between results, indirectness, imprecision, and missing-publication concerns. A neat percentage cannot repair a poorly matched population or a biased comparison. Look for both the effect estimate and an explanation of confidence in the evidence.
Sources: [3]
Separate benefit from harm rather than blending them
Use another fictional example. Suppose an intervention leads to five fewer hospital admissions per hundred people but three more episodes of temporary nausea per hundred over the same period. Simply subtracting three from five would hide the fact that these are different outcomes. Their severity, duration, reversibility, and importance to the person are different.
Now imagine that the additional outcome is a serious complication rather than mild nausea. The numerical counts could stay unchanged while the decision becomes very different. This exercise illustrates why a health decision needs clearly named benefits and harms, not a single attractive percentage. It is not an estimate of any intervention’s real balance of effects.
Practice: repair an incomplete percentage
Suppose a fictional brochure says a program lowers an unwanted outcome by 25%. Start by asking for the original risk. If the answer is 8 in 100 over two years, a 25% relative reduction would correspond to 6 in 100 over that period: two fewer people per hundred, or a two-percentage-point reduction. If the original risk were instead 4 in 100, the corresponding figure would be 3 in 100: one fewer person per hundred.
The brochure has not become more informative because you found a larger or smaller number. It has become more informative because the comparison is now explicit. Write the denominator and period beside every estimate, and label these calculations as hypothetical assumptions until actual study results support them.
Population averages are not personalized predictions
A study-group average is a useful starting point, but applying it to an individual requires care. NCI’s work on absolute-risk modeling combines risk-factor information and evaluates how models perform in independent data. A credible individualized estimate requires an appropriate, validated method rather than adjusting a published percentage by intuition.
If a group estimate differs from your circumstances, ask which characteristics matter and whether the evidence actually supports a different estimate. It is reasonable for the answer to include uncertainty. False precision is less useful than a clear explanation of what can and cannot be inferred.
Sources: [6]
A short checklist for the next health claim
Ask for the outcome, the people studied, the comparison option, and the follow-up period. Then request both absolute risks in the same format: for example, events per 100 or per 1,000 people. Ask whether the headline percentage is a risk ratio, relative reduction, odds ratio, or hazard ratio, and whether uncertainty or important harms were omitted.
CDC risk-communication guidance recommends showing absolute numbers and using consistent denominators, rather than relying on a relative-risk phrase alone. A practical final question is: if one hundred people like those in this study choose each option, what outcomes might occur over the relevant period? Take that answer into a discussion with a qualified healthcare professional. The arithmetic can clarify the evidence; it cannot determine your personal priorities or replace clinical judgment.
Sources: [4]
Sources & further reading
- Chapter 6: Choosing effect measures and computing estimates of effectChecked 2026-10-20
- Chapter 15: Interpreting results and drawing conclusionsChecked 2026-10-20
- Chapter 14: Completing Summary of findings tables and grading the certainty of the evidenceChecked 2026-10-20
- Understanding and Applying Risk Communication PrinciplesChecked 2026-10-20
- Cancer Screening Overview: How Is Cancer Risk Measured?Checked 2026-10-20
- Absolute Risk ModelingChecked 2026-10-20
About this article
Prepared with AI assistance and an AI fact-checking pass against the sources listed above. No human clinical review is claimed. Evidence may change; consult appropriate qualified professionals for decisions about your circumstances.
Spotted a problem? Suggest a correction.