Medicine · 7 min read
Sensitivity specificity and predictive values explained
A test can detect 90% of cases while only half its positive results are true positives. The difference is the denominator.
General educational information, developed with AI assistance and AI review. Not individual medical advice, a diagnostic interpretation, or a human clinical review. Discuss personal testing and treatment decisions with a qualified healthcare professional.
Information may contain errors, omissions or outdated guidance. This article is general education, not individual medical or other professional advice. Verify important information before acting and consult an appropriately qualified professional. Never disregard medical advice, delay care or change treatment because of this article. See our accuracy disclaimer and terms.
Four questions hidden inside the word accuracy
A claim that a medical test is accurate leaves an important question unanswered: accurate at doing what? Finding people who have a condition is one task. Correctly reassuring people who do not have it is another. Explaining the meaning of an already positive result asks a different question again. These tasks involve different denominators, even when every calculation comes from the same group of people.
Sensitivity asks what fraction of people with the target condition test positive. Specificity asks what fraction without it test negative. Positive predictive value, or PPV, asks what fraction of positive results belong to people with the condition. Negative predictive value, or NPV, asks what fraction of negative results belong to people without it. Keep the starting group in mind before reading the percentage. NLM identifies sensitivity and specificity as measures used for binary classification.
First establish what counts as the condition
A study needs a credible way to establish whether participants have the condition being investigated. This is its reference standard: the best available method for that purpose, which can involve a test, clinical criteria, follow-up, or a combination. A comparison with another imperfect test may show agreement without establishing correctness. Two methods can make the same mistakes.
FDA guidance distinguishes diagnostic accuracy against a reference standard from agreement with a non-reference comparator. It also emphasizes a representative intended-use population, transparent handling of uncertain results, and confidence intervals. A performance percentage from a small selected sample is an estimate, not a permanent property that applies unchanged to every future patient.
For the exercise below, assume that condition status is known correctly for everyone, nobody has an indeterminate result, and the same test rule is applied throughout. Those simplifying assumptions make the arithmetic visible. They deliberately set aside difficulties that a real diagnostic study must address.
Sources: [1]
Build a hypothetical group before calculating percentages
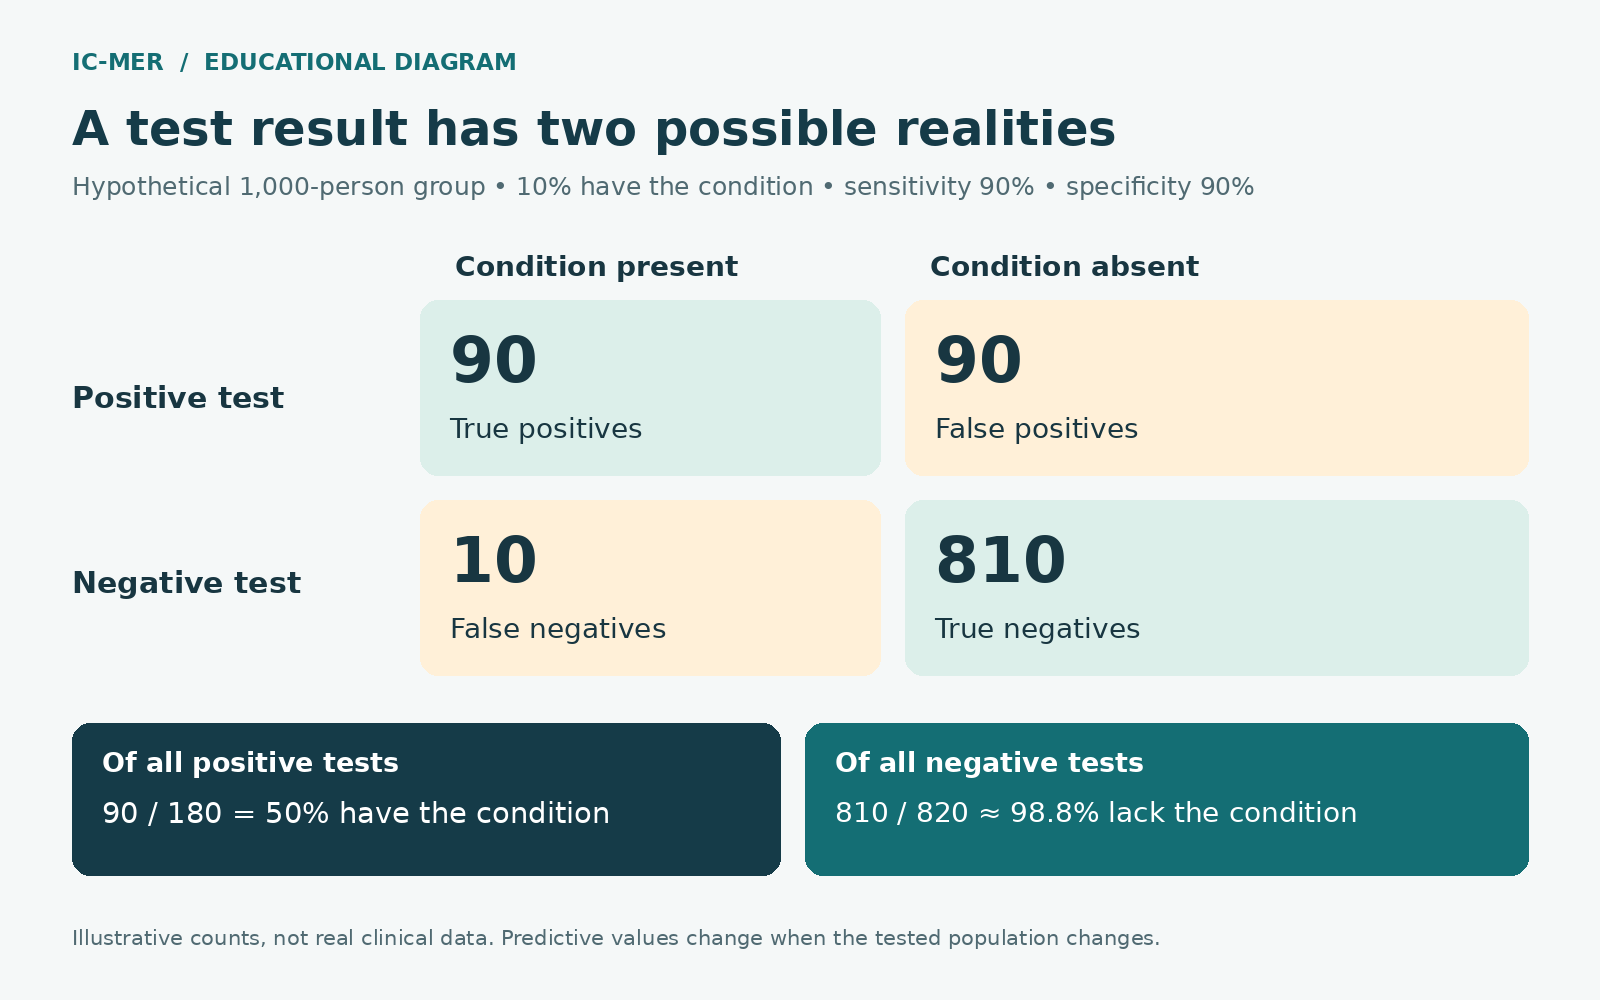
Imagine 1,000 people being tested for one fictional condition. Exactly 100 have the condition and 900 do not. Assume sensitivity is 90% and specificity is also 90%. These are invented teaching numbers, not the performance of a product or results from IC-MER research.
Start with the 100 people who have the condition. Ninety test positive: these are true positives. The remaining ten test negative: these are false negatives. Now start with the 900 people who do not have the condition. Eight hundred ten test negative: these are true negatives. The remaining ninety test positive: these are false positives.
Check both sides of the ledger. The condition-present column contains 90 plus 10, which is 100. The condition-absent column contains 90 plus 810, which is 900. The positive-result row contains 180 people, and the negative-result row contains 820. Together, these rows contain the original 1,000 people. This cross-check prevents a surprisingly common mistake: dividing by the total tested when the question concerns only one subgroup.
Sensitivity is 90 divided by 100, or 90%. Specificity is 810 divided by 900, also 90%. So far, the denominator is determined by condition status. We have not yet answered what a positive result means.
Turn the table around to interpret a result
Of the 180 people who test positive, only 90 have the condition. The PPV is therefore 90 divided by 180, or 50%. The other half are false positives. This is fully consistent with 90% sensitivity and 90% specificity. The figures answer different questions and do not contradict one another.
Of the 820 people who test negative, 810 do not have the condition. The NPV is 810 divided by 820, approximately 98.8%. The remaining ten people do have it despite testing negative. For this group, the proportion with the condition among negative results is about 1.2%, the complement of NPV. It is not 10%: that figure describes the false-negative fraction among people who have the condition.
A useful language exercise is to finish the sentence before writing a formula. “Among people with the condition…” points toward sensitivity. “Among people without the condition…” points toward specificity. “Among people who tested positive…” points toward PPV. “Among people who tested negative…” points toward NPV. Underline the word after “among” whenever a headline seems confusing.
Change prevalence and repeat the arithmetic
Prevalence describes how common the condition is in the population being considered. With sensitivity and specificity held fixed, a lower prevalence produces a lower PPV and a higher NPV. NCI explains this relationship in its screening overview. For an individual, clinical circumstances help determine the probability before testing; a population average cannot simply replace that assessment.
Now imagine another 1,000 people, but only ten have the fictional condition. Keep the same assumed 90% sensitivity and 90% specificity. There are nine true positives and one false negative. Among the 990 people without the condition, there are 891 true negatives and 99 false positives. PPV is nine divided by 108, approximately 8.3%. NPV is 891 divided by 892, approximately 99.9%.
The test has not become malicious or mathematically inconsistent. There are simply many more opportunities for a false positive among the large group without the condition. Nine correct positive results are now mixed with 99 false alarms. The hypothetical comparison shows why a marketing percentage cannot be carried from one testing population to another without checking its context.
These examples hold sensitivity and specificity constant to isolate the effect of prevalence. Actual studies can also differ in disease severity, patient selection, specimen handling, and other circumstances. The exercise is an explanation of probability, not a forecast of a real screening campaign.
Look beyond a reassuring overall percentage
In the first example, the number classified correctly is 90 plus 810, or 900 out of 1,000: 90% overall. Yet half the positive results are false positives. That single overall figure hides the issue that matters to someone who has just received a positive result.
In the second example, an imaginary rule that labels everyone negative would classify 990 of 1,000 people correctly, an apparent 99% overall accuracy. It would miss all ten people with the condition. This intentionally useless rule shows why an impressive overall percentage is insufficient for judging a medical test.
Write a small evidence note when comparing test claims: target condition, population, reference standard, threshold, true and false result counts, and uncertainty. If a brochure gives only a percentage, record the missing denominator as a question rather than supplying one yourself. If two studies used different definitions of the condition, acknowledge that the comparison may not be like for like.
As a final practice task, cover the percentages and reconstruct the first example from the four counts alone. Begin with 90 true positives, ten false negatives, 90 false positives, and 810 true negatives. Add the appropriate row or column before dividing. Then explain to another reader why there are 180 positive tests but only 100 people with the condition. If your explanation works without using the word accuracy, you have probably identified the right distinction. This exercise checks arithmetic and terminology; it does not validate a real test or establish a diagnosis.
Use the numbers to improve the conversation
Lab results are interpreted alongside health history, examination, and other information. MedlinePlus explains that positive results may need confirmation, negative results sometimes need follow-up, and uncertain results are a separate category. Preparation instructions and medicines or supplements can affect some tests. A normal result does not supply a complete assessment of every possible health problem.
Useful questions include: Why was this test chosen? What did we think was likely before testing? Was this test studied in people like me? What follow-up would change the interpretation? Who will explain an uncertain result? What should I do if symptoms persist? These questions support a discussion; they do not prescribe a particular test sequence.
Avoid translating the fictional 50% or 8.3% PPV into your own probability. You would need the relevant test, population, circumstances, and clinical evaluation. The transferable skill is recognizing which group supplies the denominator. Once that is clear, sensitivity, specificity, and predictive value become four understandable questions instead of four interchangeable promises.
Sources: [4]
Sources & further reading
- FDA: Statistical Guidance on Reporting Results from Studies Evaluating Diagnostic Tests (2007)Checked 2026-10-21
- NCI: Cancer Screening Overview, health professional PDQChecked 2026-10-21
- NLM MeSH: Sensitivity and SpecificityChecked 2026-10-21
- MedlinePlus: How to Understand Your Lab ResultsChecked 2026-10-21
About this article
Prepared with AI assistance and an AI fact-checking pass against the sources listed above. No human clinical review is claimed. Evidence may change; consult appropriate qualified professionals for decisions about your circumstances.
Spotted a problem? Suggest a correction.