Medicine · 4 min read
Statistical significance and clinical importance are different questions
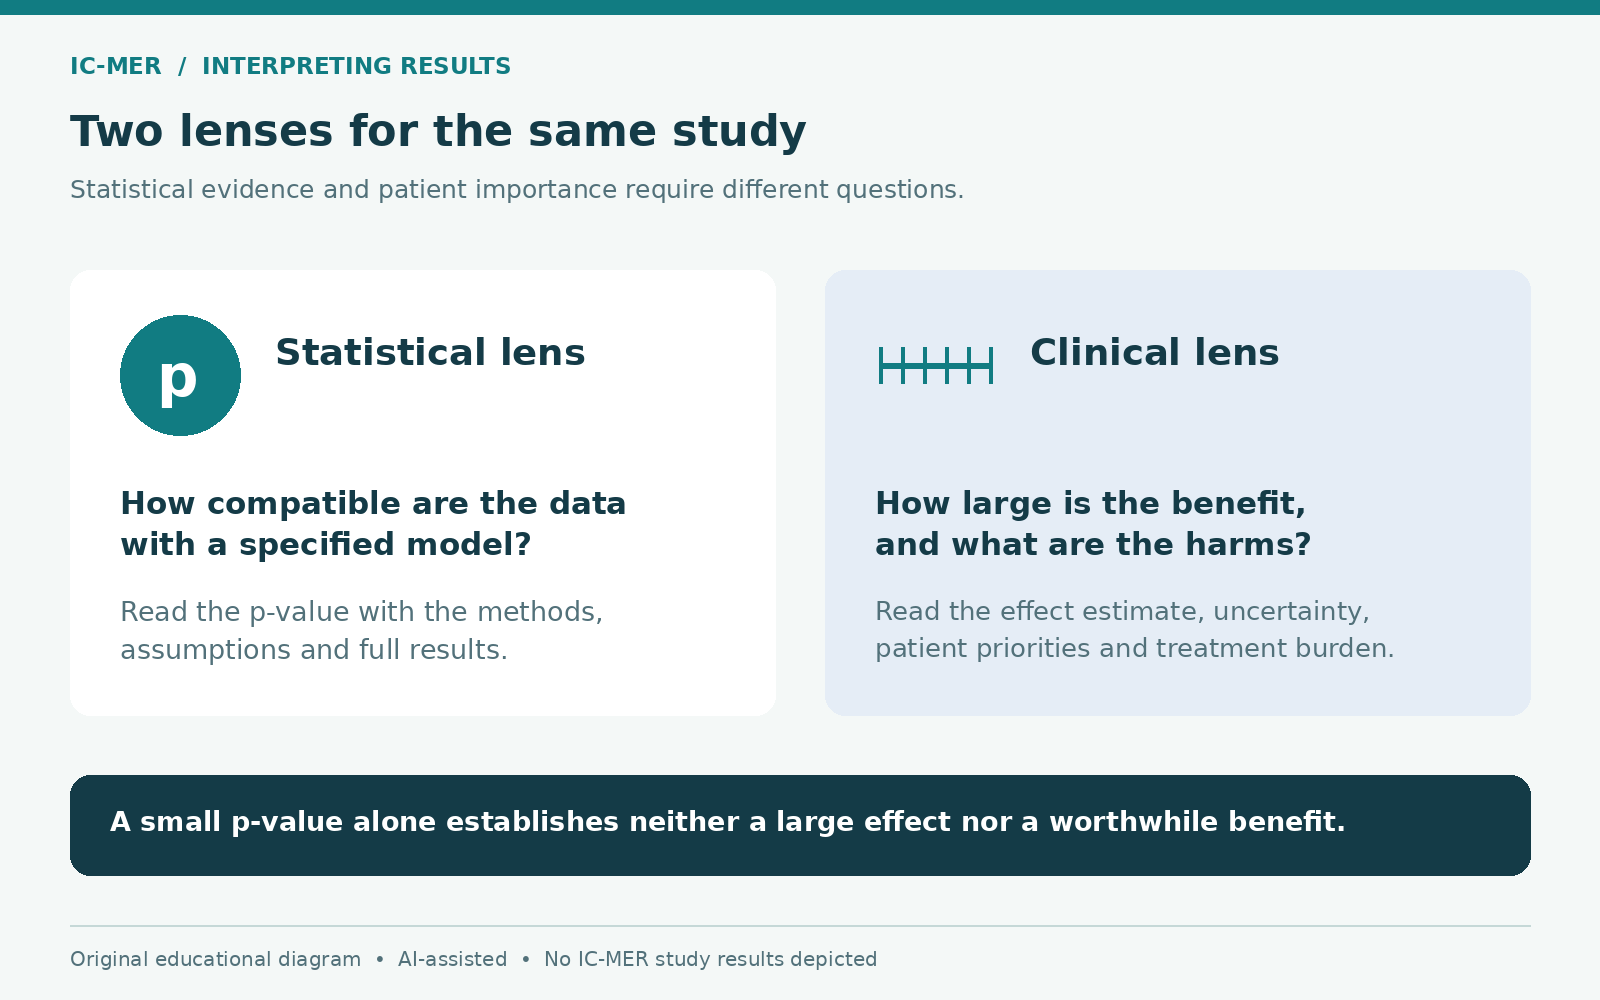
A small p-value does not measure how much a treatment helps. Read the effect, its uncertainty and the patient tradeoffs together.
Educational research-literacy information, prepared with AI assistance, not individual medical advice or a recommendation to start or stop treatment. Hypothetical examples are not clinical findings.
Information may contain errors, omissions or outdated guidance. This article is general education, not individual medical or other professional advice. Verify important information before acting and consult an appropriately qualified professional. Never disregard medical advice, delay care or change treatment because of this article. See our accuracy disclaimer and terms.
Separate the statistical question from the practical one
“Statistically significant” is not a synonym for large, important or worthwhile. A study can estimate a small difference precisely, or estimate a potentially important difference too imprecisely to resolve it. Read the size of the effect, its uncertainty and the outcome before deciding what a statistical label contributes.
A p-value is calculated under a specified statistical model, commonly including a null hypothesis of no difference. It describes how often results at least as extreme as those observed would occur under that model. Interpreting it depends on the assumptions and analysis used. It does not directly tell us whether a patient should choose a treatment.
Sources: [1]
What the number does not say
The American Statistical Association’s 2016 statement warns that a p-value is not the probability that the tested hypothesis is true, nor the probability that the data were generated by chance alone. A p-value of 0.03 therefore does not mean there is a 97 percent chance the treatment works. Nor does it measure the size or importance of the result.
The statement also argues against basing a scientific conclusion solely on crossing a threshold. When a report uses 0.05, a result just below it and one just above it should not be read as opposite biological truths. Ask what the study estimated and how precisely, rather than treating a small change in the label as a transformation of the evidence.
Sources: [2]
Read the effect estimate and interval together
A confidence interval accompanies an estimate with information about its precision. NIST explains that narrower intervals represent more precise estimation. In the frequentist interpretation, 95 percent confidence refers to the long-run performance of the method: across repeated sampling under its assumptions, about 95 percent of such intervals would include the true value. It is not a 95 percent probability assigned to the particular fixed parameter after seeing this interval.
For a reader, the practical exercise is to write down the estimate and both bounds, with their units. Then ask whether the interval includes effects small enough to be unimportant or large enough to change the decision. Also ask what uncertainties the statistical method leaves out; a narrow interval does not, by itself, resolve every concern about how the study was conducted.
An illustrative comparison
Consider a fictional symptom scale from zero to 100, with lower scores better. Suppose investigators and patient partners selected five points as the difference worth pursuing for this particular decision. This is an invented teaching threshold, not a validated rule for any clinical instrument.
Study A estimates two points of benefit, with a 95 percent confidence interval from one to three points. With an appropriate corresponding two-sided test, the interval excludes no difference, but it remains below the five-point target. Study B estimates six points, with an interval from two points worse to fourteen points better. Its estimate is more promising in size, yet its uncertainty includes worsening and substantial benefit. Neither result can be understood adequately from a yes-or-no significance label.
These illustrative intervals are not calculated from real patient data. They demonstrate two separate questions: how precisely was an effect estimated, and how does its possible magnitude compare with a stated practical target?
Sources: [1]
Check the analysis and the patient tradeoffs
The ASA president’s 2021 task force emphasized that properly used p-values remain useful tools. It also highlighted study design, model choice, selective reporting and multiple analyses as matters that affect inference. Ask whether the main analysis was specified in advance, how many outcomes or subgroups were examined, and whether the report explains its handling of multiple comparisons.
For the fictional symptom treatment, the next reading questions are deliberately concrete. Was the score measured after a week or a year? What inconvenience accompanied treatment? Were harms measured over the same period? Would a smaller improvement be valued by someone with different priorities? These questions help frame a clinical conversation; they do not turn an invented five-point threshold into universal advice.
Sources: [4]
Write a conclusion that preserves uncertainty
A useful personal note might read: “The estimated benefit was two points, with an interval from one to three; our teaching example’s five-point target was not reached.” For Study B: “The estimate suggests possible benefit, but the interval is too wide to resolve whether the target was achieved.” Both statements retain information that a significance label hides.
Keep the study population, comparator and follow-up beside that note. Ask a qualified clinician how the evidence relates to an individual decision. A statistical result is one component of that discussion, alongside the relevance of the outcome, the reliability of the study and the person’s priorities.
Sources & further reading
- Cochrane Handbook, Chapter 15: Interpreting results and drawing conclusionsChecked 2026-10-21
- ASA Releases Statement on Statistical Significance and P-Values (2016)Checked 2026-10-21
- NIST/SEMATECH e-Handbook: Confidence Limits for the MeanChecked 2026-10-21
- ASA President’s Task Force Statement on Statistical Significance and Replicability (2021)Checked 2026-10-21
About this article
Prepared with AI assistance and an AI fact-checking pass against the sources listed above. No human clinical review is claimed. Evidence may change; consult appropriate qualified professionals for decisions about your circumstances.
Spotted a problem? Suggest a correction.